Uncategorized

How to know if a stock setup has real edge

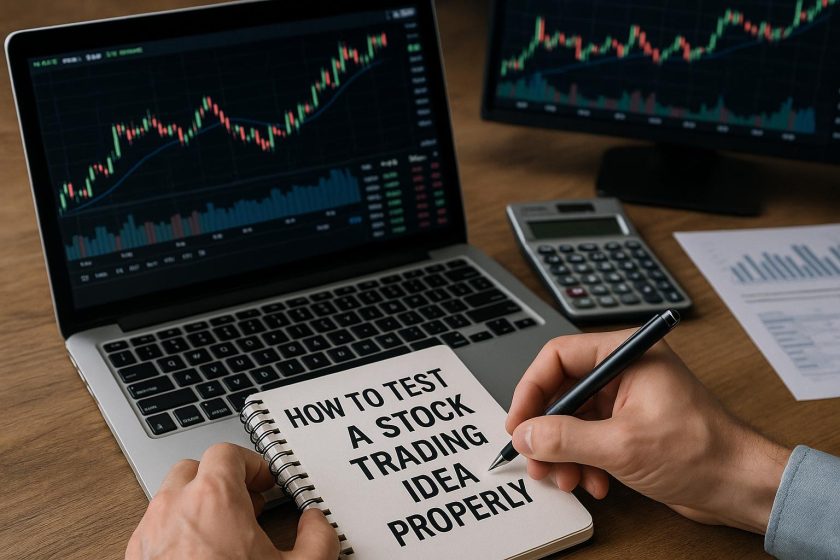
Understanding Stock Setups with Real Edge

In the realm of stock trading, identifying a setup with a real edge can significantly impact a trader’s overall success. Unlike gambling or mere speculation, trading with a real edge involves a calculated and informed methodology for navigating the stock market. This meticulous approach is founded on data, analysis, and strategic planning rather than relying on luck or intuition.

Defining a Real Edge

A real edge in trading is about gaining a strategic or statistical advantage that over a series of trades results in a higher probability of profitable outcomes compared to non-profitable ones. To ascertain whether a stock setup carries such an edge, traders delve into historical data, thoroughly analyze market conditions, and evaluate other pertinent factors that might influence trading decisions.

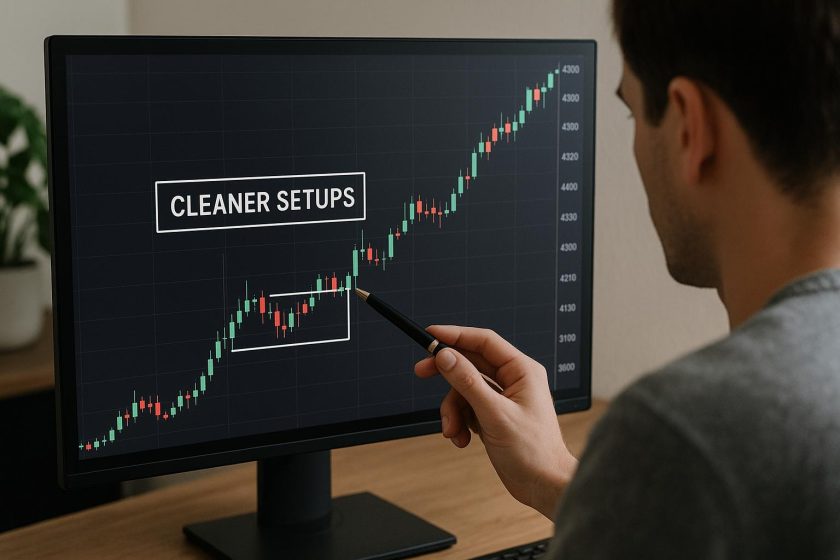
Data-Driven Analysis

Analyzing past performance is integral to identifying stock setups with a genuine edge. Traders frequently engage in technical analysis, which involves examining charts and identifying patterns. Common tools include techniques such as moving averages, support and resistance levels, and momentum indicators. Nonetheless, it is crucial to understand that while past performance cannot guarantee future results, it can indeed provide valuable insights into potential market behaviors.

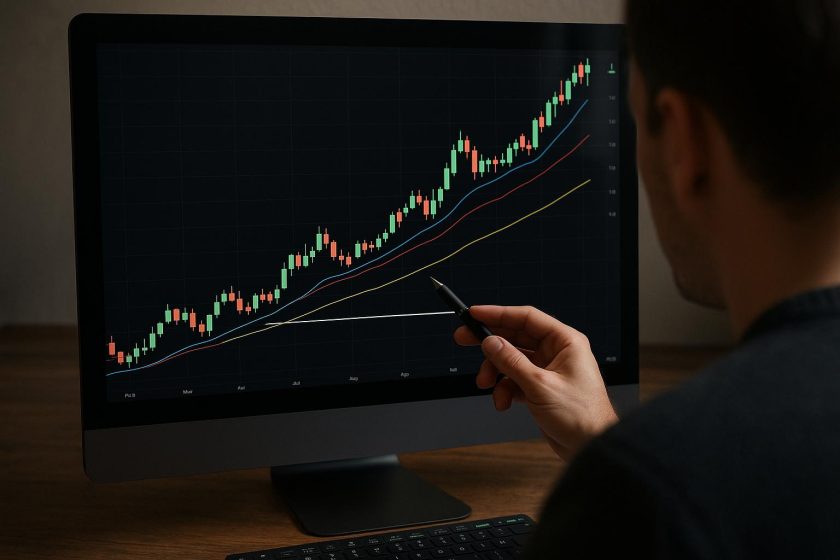
Technical Indicators

Within the realm of technical analysis, traders utilize an array of indicators to aid their decision-making processes. Moving averages, for example, help in smoothing out price data to identify trends over a specific period. On the other hand, momentum indicators gauge the speed at which stock prices are changing, which can be pivotal in making informed trade decisions.

Consider Market Conditions

The prevailing market conditions significantly influence whether a stock setup possesses a real edge. Unpredictable events such as political shifts, economic indicators, or sector-specific changes can markedly affect stock performance. Consequently, traders are encouraged to stay informed about these external developments, as they can alter the efficacy of even the most well-crafted trading strategies.

Economic Indicators

Traders should pay close attention to key economic indicators that can impact market conditions. These indicators, such as GDP growth rates, employment figures, and inflation levels, often influence investor sentiment and market movements. Understanding these indicators can provide traders with a more comprehensive view of the broader market environment, aiding in the identification and execution of setups with a real edge.

Evaluate Risk/Reward Ratio

A critical attribute of a stock setup with an edge is the evaluation of a favorable risk/reward ratio. This involves ensuring that the potential gains significantly outweigh the associated risks or possible losses. By adopting a rational approach towards risk management, traders cultivate an environment where their edge can be nurtured and sustained over time.

Setting Stop-Loss and Take-Profit Levels

A pragmatic approach to managing risk involves setting appropriate stop-loss and take-profit levels. Stop-loss levels help minimize potential losses by automatically closing a position when the price reaches a predetermined level, while take-profit levels ensure that gains are realized by closing the position once it reaches a target profit point. Disciplined adherence to these levels is vital to maintaining a favorable risk/reward balance.

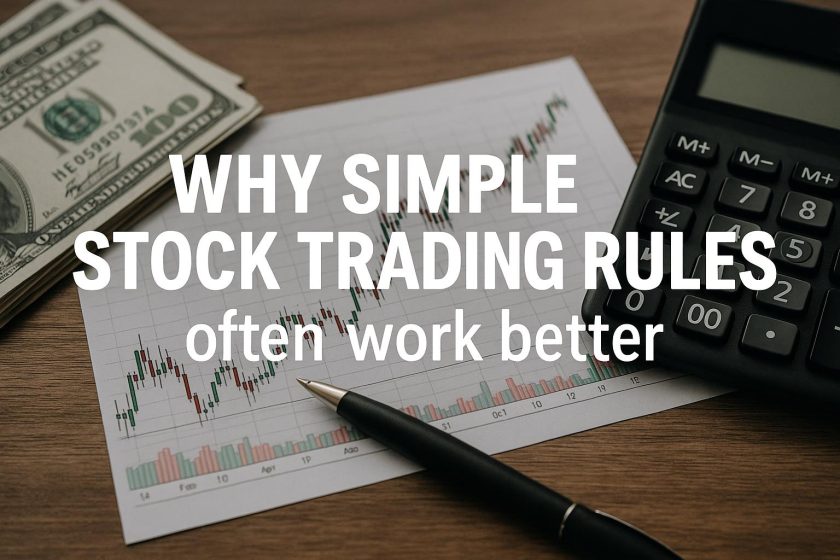
Strategy and Discipline

Possessing a real trading edge is only one part of the equation. The trader’s ability to adhere to their formulated strategy and manage emotions also plays a crucial role in overall success. Consistency and discipline in executing trades are imperative. Reacting impulsively or adjusting one’s approach based on fleeting emotions can quickly nullify any potential edge.

Backtesting Strategies

To ascertain the effectiveness of a given strategy, traders engage in backtesting, which involves applying the trading strategy to historical data in order to assess its past performance. This process helps determine whether a particular setup offered a real edge historically. Nonetheless, traders must employ robust backtesting software and methodologies to avoid overfitting data, which could result in false conclusions.

Understanding Overfitting

Overfitting is a scenario where a backtested strategy performs exceptionally well on historical data but fails to deliver similar results in a live trading environment. This occurs when a strategy is overly tailored to past data, capturing noise rather than genuine patterns. Traders should be aware of this risk and strive for strategies that exhibit robust performance across varied data sets.

Seek Expert Insights

While self-analysis is crucial, seeking the insights of seasoned traders or reliable educational resources can provide valuable perspectives. Engaging in trading forums and joining professional trading groups allows for access to analytical tools and opportunities for collaborative learning. Utilizing educational tools from reputable trading platforms can further enrich a trader’s understanding and efficacy.

Mentorship and Networking

Engaging with experienced traders through mentorship programs can be immensely beneficial. Mentors can offer personalized guidance, share valuable lessons from their trading experiences, and provide feedback on strategy development. Networking with peers also fosters an environment of mutual learning, allowing for the exchange of ideas and strategies.

Continuous Evaluation

Given the dynamic nature of financial markets, maintaining a competitive edge in stock trading requires regular evaluation and adjustment of strategies. What provides an edge today may not remain effective indefinitely. As such, traders should develop adaptability and be willing to evolve their strategies in response to new information, market shifts, and technological advancements.

Monitoring Performance

Consistently monitoring the performance of trading setups is crucial for ongoing success. Traders should regularly review trading outcomes to identify trends, areas of strength, and potential weaknesses in their approach. This ongoing evaluation enables timely adjustments that can preserve or enhance a trader’s edge.

Adapting to Technological Advances

As technological advancements redefine the trading landscape, traders must remain abreast of new tools and techniques that can enhance their trading strategies. Algorithmic trading, machine learning, and artificial intelligence are examples of technologies that can provide sophisticated insights and improve decision-making processes. Staying open to adopting new technologies can fortify a trader’s approach and maintain their edge.

By engaging in comprehensive analysis, maintaining discipline, and continuously refining their approach, traders can identify stock setups with a real edge, thereby enhancing their potential for achieving long-term success in the stock market.

Uncategorized

How to test a stock trading idea properly

Understanding the Basics of Testing a Stock Trading Idea

Testing a stock trading idea involves several steps, each crucial for determining the potential success and profitability of the strategy. Proper testing can help in minimizing risks and increasing gains. The process can generally be broken down into multiple steps from ideation to evaluation.

Step 1: Define the Trading Idea

The foundation of any testing process begins with a clear and concise definition of the trading idea. This idea should be grounded, whether it stems from technical indicators, fundamental analysis, or a unique blend of the two. The articulation of the trade must encompass specific conditions for both entry and exit. Additionally, it’s essential to outline risk management strategies and position sizing to ensure that the strategy aligns with your financial goals and risk tolerance. Each component of the trading idea sets the groundwork for the subsequent steps. A comprehensive definition helps streamline the testing process, ensuring that the trader’s vision is meticulously transformed into an executable strategy.

Step 2: Collect Historical Data

Acquiring accurate historical data is a critical step that sets the stage for backtesting. This data typically encompasses prices, volumes, and other pertinent market conditions that would have affected trading outcomes. The richness of the data in terms of granularity and accuracy cannot be overstated, as it directly impacts the validity of the backtest results. There are various platforms from which historical data can be obtained; however, the choice of platform should be driven by the assurance of data quality and suitability for the intended analysis. Historical data acts as a proxy to test a strategy’s response to real-world market scenarios in the past.

Step 3: Backtesting

With the trading idea defined and historical data collected, the next step is backtesting. Backtesting entails applying the trading strategy to historical data to evaluate its performance over previous periods. Automated trading platforms and programming languages like Python are often utilized to execute backtesting efficiently. This step aims to provide insight into how the strategy would have performed in the past, effectively setting expectations for future application. During backtesting, it’s critical to measure key performance metrics, which include:

Win Rate: The percentage of trades that result in profit.

Profit Factor: This measures the ratio of total profit to total loss, providing a risk-reward evaluation.

Maximum Drawdown: The most significant decline in the strategy’s portfolio value, which helps gauge risk levels.

Thoroughly understanding these metrics will provide clarity on the strategy’s historical efficacy and areas requiring enhancement.

Step 4: Analyze the Results

Following backtesting, a meticulous analysis should be conducted to discern the strengths and limitations inherent in your trading idea. This analysis entails sifting through successful and unsuccessful trades to identify patterns or anomalies that could guide strategy refinement. Recognizing elements such as market conditions where the strategy thrives or falters will inform any necessary adjustments to the trading idea. Patterns might emerge that signal prevailing trends influencing the strategy’s outcomes. Understanding these patterns builds foundational knowledge that can transform strategic weaknesses into strengths.

Step 5: Forward Testing

Forward testing, also known as paper trading, involves applying your strategy to live market conditions without risking actual financial resources. This step offers a valuable bridge between theoretical backtesting and real-world application, as it allows for strategy testing without financial exposure. Using platforms that support paper trading, traders have the opportunity to observe and refine strategies in current markets. The real-time application of strategies also highlights evolving market conditions that might not have been apparent in historical data, thereby providing assurance of the strategy’s robustness and adaptability under contemporary conditions.

Step 6: Risk Management Strategy

Upon concluding forward testing, the subsequent focus should shift to developing a robust risk management strategy. Between testing phases, concrete risk management tactics must be established, such as determining stop-loss levels to curtail potential losses and devising portfolio diversification methods to balance exposure. Additionally, appropriate leverage should be meticulously computed, ensuring that it aligns with your risk appetite and does not inadvertently magnify potential losses. Effective risk management functions as a safeguard, ensuring that financial losses remain within pre-established parameters and shielding overall capital.

Step 7: Iterative Improvement

The pathway to a reliable and successful trading strategy is often one of iterative refinement. The insights derived from testing phases should be comprehensively analyzed and used to improve and optimize the trading idea continually. This might involve recalibrating technical indicators, refining entry and exit criteria, or other adjustments that align with evolving markets and personal trading goals. As market dynamics fluctuate, traders that commit to continuous improvement and proactive adaptability generally command a strategic advantage. Thus, successful traders view testing as an unceasing cycle, frequently reviewing and adjusting strategies to maintain a competitive edge.

Final Considerations

The art and science of testing a stock trading idea demand patience, precision, and perseverance. Whether standing at the threshold as a novice or advancing as a seasoned trader, understanding and applying these testing steps equip you with a structured approach critical to crafting effective and robust trading strategies. The pursuit of deeper knowledge in specific testing techniques or understanding the intricacies of stock trading requires engagement with reputable educational resources and reliable analytics platforms. While the groundwork for these testing stages has been laid, a commitment to lifelong learning and dynamic adaptation remains paramount in navigating the sophisticated tapestry of stock trading successfully.

Uncategorized

Why simple stock trading rules often work better

Introduction

When it comes to stock trading, there is a tendency for traders to become engrossed in complex strategies and technical indicators. Yet, simple stock trading rules often outperform intricate methodologies. Understanding why simplicity prevails can assist traders in making informed decisions with greater confidence. This discourse explores the benefits of simplicity in stock trading, unraveling the complexity paradox, showcasing adaptability, reducing emotional biases, understanding the ease of testing, and appreciating cost-effectiveness.

The Complexity Paradox

Many traders assume that a more complex strategy will yield better results. This is known as the complexity paradox: the assumption that complexity equates to effectiveness. However, in the world of stock trading, more complex strategies can often lead to overfitting and a lack of adaptability. Overfitting occurs when a model is too finely tuned to a specific dataset, meaning it performs poorly in unpredictable market conditions.

Adaptability in Changing Markets

Simple trading rules tend to be more adaptable. Markets are inherently unpredictable, with countless variables influencing outcomes. Complex rules designed for specific conditions may falter when unexpected changes occur. Simple rules, however, can provide a flexible framework that allows traders to pivot strategies with minimal adjustments. This flexibility is crucial as it enables traders to respond effectively to market dynamics without the need for constant recalibration. Such adaptability ensures that simple trading rules remain applicable across diverse situations, enhancing their sustainability in different market climates.

Reduction of Emotional Bias

Stock trading is as much a battle against one’s emotions as it is against the market. Traders often fall prey to emotional biases such as fear or greed, leading to impulsive decisions. Simple trading rules can serve as a consistent guide, minimizing the role of emotions in decision-making. By relying on straightforward rules, traders can focus on objective data rather than emotional reactions.

Reduced Cognitive Load

The human brain can manage only a set amount of information at once. Complex strategies can lead to cognitive overload, causing traders to make errors or second-guess their decisions. Simple rules reduce cognitive load, allowing traders to make quicker, more confident decisions. This can be especially crucial in fast-paced trading environments where timing is key. The reduction in cognitive demand not only enhances decision-making speed but also contributes to the mental well-being of traders, preventing burnout and maintaining consistent performance over time.

Testing and Backtesting

One of the advantages of simple trading rules is the ease of testing and backtesting. The ability to test a strategy on historical data is vital for understanding its potential effectiveness. Simple rules are straightforward to implement in backtesting software, allowing traders to evaluate their viability over time. This process is less error-prone compared to more complex strategies that require numerous inputs and assumptions.

Accuracy and Reliability

The simplicity of the rules ensures fewer variables, which translates to improved accuracy and reliability during testing. With a straightforward approach, traders can be more confident in the backtesting results, knowing that these results are less likely to be skewed by excessive parameters or assumptions. The simplicity further aids in identifying which elements of a trading strategy are genuinely effective, facilitating informed adjustments and refinements based on clear, data-driven insights.

Cost Effectiveness

Complex trading strategies often necessitate costly tools, software, and subscriptions to data feeds, all of which can reduce overall profitability. On the other hand, simple rules can be implemented with minimal resources, making them more accessible to individual traders. This accessibility is of particular importance for novice traders or those with limited capital, as it eliminates barriers to entry and permits engagement with the market without significant financial strain. Keeping costs low ensures that more of the profits remain in the trader’s pocket.

Maximizing Profit Margins

By limiting the expense associated with intricate strategies, traders not only maintain higher profit margins but also enhance their agility in the market. Without the overhead of continuous expenses tied to various trading aids, traders can reinvest their earnings more strategically, fostering long-term growth and stability. The cost-effectiveness of simple rules thus contributes to both immediate and future financial health, aligning with the overarching goal of sustained profitability in stock trading.

Conclusion

While complexity may seem attractive, the inherent flexibility, effectiveness, and ease of implementation of simple stock trading rules often lead to better long-term results. In the ever-changing world of markets, having a simple, adaptable approach allows traders to navigate uncertainty with greater assurance and success. For more information on effective trading strategies, consider consulting seasoned experts and reputable financial resources. Simple trading rules, with their broad applicability and proven effectiveness, underscore a valuable approach in the pursuit of trading success in various market conditions. By prioritizing simplicity over complexity, traders position themselves to capitalize on opportunities with clarity and confidence, free from the constraints and pitfalls commonly associated with more elaborate trading methodologies.

Uncategorized

How to spot cleaner stock setups more often

Understanding Clean Stock Setups

Investors and traders often strive to find what they term as “clean” stock setups. These setups are particularly appealing because they offer clear signals and are seen as providing a somewhat predictable potential gain or loss, thus facilitating more informed decision-making. Analyzing these setups is not a straightforward task; it requires an integration of technical analysis, market sentiment, and data evaluation. These elements together form the backbone of distinguishing clean stock setups from more complicated or misleading scenarios.

Technical Analysis

One of the fundamental approaches to identifying clean stock setups is through technical analysis. This approach involves scrutinizing past market data, focusing primarily on price movement and volume. Some of the key technical indicators utilized in this process include:

Moving Averages: Moving averages are a popular tool within technical analysis due to their simplicity and efficiency. These averages smooth out price data by creating a constantly updated average price over a specific period. For short-term trend analysis, the 50-day moving average is predominantly used, providing insights into recent market trends. On the other hand, the 200-day moving average, more suited for long-term trend analysis, can help analysts identify overarching market directions.

Support and Resistance Levels: These levels are crucial concepts in technical analysis. A support level occurs when a stock’s price stops decreasing, while a resistance level is identified when a stock’s price ceases rising. By observing these levels, traders can predict potential breakout (when prices rise above a resistance level) or breakdown (when prices fall below a support level) points, thereby identifying potential trading opportunities.

Candlestick Patterns: Candlestick patterns are another significant focus within technical analysis. Patterns such as Doji (indicative of market indecision), Hammer (suggesting reversal), and Engulfing (indicating a potential market continuation or reversal) serve as critical signals for spotting potential trends or reversals, thus forming the basis for identifying cleaner stock setups.

Market Sentiment

Apart from the technical indicators, understanding market sentiment is crucial for assessing stock setups. Sentiment analysis involves gauging the mood of the market, which can have a significant impact on stock movements. This analysis can be done through several methods:

News Trends: Staying updated with news trends is an effective way to gauge market sentiment. Financial news platforms, such as Bloomberg, provide real-time updates that can indicate shifts in market sentiment. Analyzing these shifts can give traders a sense of potential stock movements.

Social Media Insights: Social media platforms like Twitter often serve as dynamic and real-time indicators of market sentiment. A sudden spike in positive or negative sentiments expressed on these platforms can be a precursor to a significant stock movement. The challenge lies in discerning valuable insights from the vast amount of data available on these platforms.

Data Evaluation

Accurate and comprehensive data evaluation is paramount in identifying clean stock setups. An in-depth evaluation involves several techniques:

Volume Analysis: Volume analysis focuses on the amount of trading that occurs with each price movement. A high trading volume during a breakout signals robustness in the setup and indicates strong participation by investors, which often translates to more reliable stock movements.

Relative Strength Index (RSI): The RSI is a momentum oscillator that gauges the speed and change of price movements. An RSI reading above 70 might suggest that a stock is overbought and due for a correction, whereas an RSI below 30 could indicate that it is oversold and might be poised for a rebound. Thus, RSI is instrumental in identifying potential entry or exit points.

Fundamental Analysis: While technical analysis often takes precedence, the financial health of an organization cannot be overlooked. A thorough review of quarterly reports and other financial documentation is essential for validating the soundness of a setup. This combines a qualitative aspect, ensuring the technical indicators are backed by solid company performance metrics.

Implementing the Strategies

While understanding these strategies is important, the ability to implement them effectively is what distinguishes successful traders. Several best practices are noteworthy:

Consistent Monitoring: It is essential to regularly monitor watchlists and charts to ensure that setups align with the indicators discussed. Consistent monitoring allows traders to act swiftly when desired conditions are met.

Backtesting: Before relying on any strategy, backtesting it against historical data is crucial. This process enables the trader to assess the strategy’s past performance, understand its strengths and weaknesses, and refine it as necessary. Tools for backtesting are widely available on many trading platforms.

Risk Management: Despite having these setups, market unpredictability is always a factor. Implementing stop-loss and take-profit orders can effectively manage potential risks, providing a safety net and facilitating disciplined trading.

Continuous Learning and Adaptation

The financial markets are dynamic and ever-changing; hence, maintaining a static strategy can limit success. Engaging in continuous learning, whether through courses or staying updated with the latest market innovations, is vital. Online platforms such as Coursera present valuable educational resources that can empower traders and investors to enhance their knowledge and adaptability.

In essence, cleaner stock setups can provide a significant strategic advantage to traders and investors. By employing meticulous technical, sentiment, and data analyses, these setups can lead to more informed and confident decision-making in the financial markets. Combining analytical prowess with continuous adaptation and learning is integral to achieving consistent success in trading and investing.